We have already discussed one of the ways of using Computer Vision in sports in the previous article. Now we are going to look at the wider picture and learn more about other possibilities which can be achieved with the help of Machine learning, and Computer Vision in particular.
Prediction approach
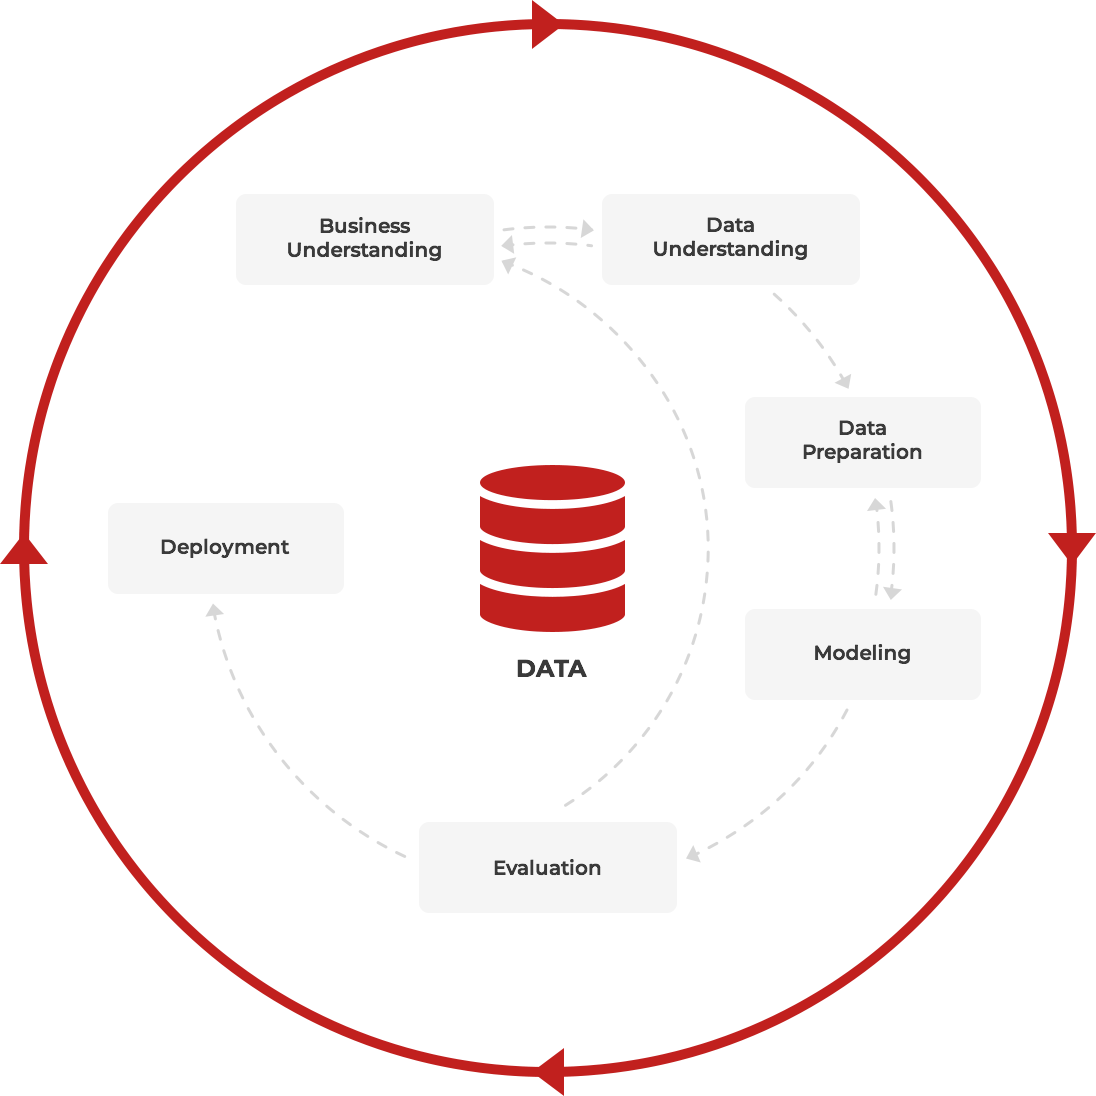
In accordance with the CRISP-DM (The Cross Industry Standard Process for Data Mining) standard, Solving a data analysis problem is a continuous process with many cycles and feedbacks. And can be represented by the following diagram:
Business and Data understanding
It includes comprehending the problem, the goal of the modeling, and the specific characteristics of the sport itself.
The level of data needs to be considered here. We can use training data at a match or team level. It is also possible to include a player-level data, which contains individual statistics of a single player throughout all matches.
At this step, objective function and model evaluation metrics are determined.
Data preparation and feature extraction
To solve this task we use the set of features above and add specific ones depending on the exact sport. Also, combinations of existing features can be added as an additional.
The following data analysis methods are used to isolate significant features: correlation analysis, cluster analysis, factor analysis, discriminant analysis, and regression analysis.
All features are converted to numeric form. Categorical features (e.g. attacking style, defending style) are converted using one-hot encoding. To perform features standardization need to transform the data so that the mean is equal to zero and the standard deviation is equal to one.
Expert assessment can be added as a weight to various features.
Also, methods for eliminating Class imbalance are applied to the date set. Class imbalance refers to prediction problems when one class is far more common than the other.
Principle Component Analysis (PCA), nonlinear PCA or an autoencoder neural network can be used in this stage for dimensionality reduction.
Modeling and Evaluation
There are a number of sport-considered Machine Learning algorithms for data analysis:
Neural Network — can be either a simple deep neural network model or a model for time series processing such as LSTM.
Naive Bayes — is a set of supervised learning algorithms based on applying Bayes’ theorem with the “naive” assumption of conditional independence between every pair of features given the value of the class variable. The model forms the probability of a particular response y with input data x. The most probable response is selected as the prediction. Naive Bayes model can be extremely fast compared to more sophisticated methods.
RandomForest
- — it is a set of decisive trees. In the regression problem, their answers are averaged, in the classification problem the decision is made by majority vote. All trees are built independently according to the following scheme:
- A subset of the training samples is selected and a tree is built on it (for each tree there is its own subset);
- To build each splitting in the tree, a subset of random features is considered (each new splitting gets its random features);
- The best features and splittings are selected by a predetermined criterion.
A tree is built, as a rule, while the subset is not empty, as long as there are no samples of only one class left in the leaves.
This construction scheme corresponds to the main ensemble principle (building a machine learning algorithm on the basis of several models): the basic algorithms must be good and diverse, therefore, each tree is built on its own training set and there is an element of randomness when choosing splits.
Gradient Boosted Decision Trees (GBDT) — is a machine learning algorithm that iteratively constructs an ensemble of weak decision tree learners through boosting.
- In general, it supposes to:
- Models data with simple models and analyze data for errors.
- These errors define data points that are difficult to fit by a simple model.
- Then for later models, iteratively focuses on hard to fit data to get them right.
- In the end, combines all the predictors by giving some weights to each one.
XGBoost is a popular implementation of gradient boosting. The extra randomization parameter can be used to reduce the correlation between trees. XGBoost has an option to penalize complex models through both L1 and L2 regularization. Regularization helps in preventing overfitting. Generally, XGBoost is faster than the normal gradient boosting.
Model selection and evaluation
Model selection is the process of choosing a model that successfully copes with a specific task. It is performed by evaluating the accuracy of the model on a train and validation data sets. The K-fold cross-validation method is used to obtain an unbiased estimate.
Since each Machine Learning model has its own parameters — there are two methods for finding model hyperparameters for the optimal parameter pool: grid search and random search. The final accuracy of the model is evaluated on the data that wasn’t seen during the training. If the best model’s accuracy is unsatisfactory, then the process returns to the data preparation, and the features set is expanded.
In the end, the best models are trained on the whole available data. Further models ensemble is formed based on this set.
Using this approach it is possible to improve almost every sports area and we consider it based on solving Injury and Outcome Prediction tasks.
Injury Prediction
At the Business understanding stage, we highlight the load analysis task for predicting Injury.
Monitoring and adjusting loads to reduce injury risk is an important aspect of athlete management, especially since injuries can have an effect on whole team performance.
After Data understanding process it’s possible to highlight several metrics which can be used by Machine Learning to quantify loads for players.
External loads refer to objective measures of training activity such as training duration, running distance, high and moderate speed running, and accelerations. Technical-tactical performance during matches can affect players’ physical fit: an average speed, a number of played competitions, an average covered distance, a number of minutes played and average field goals attempts.
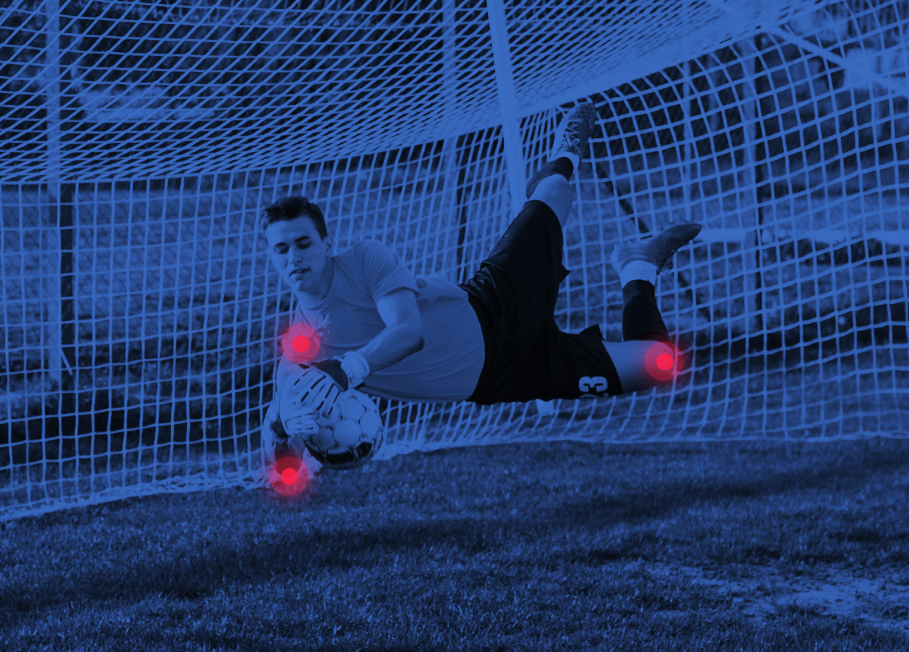
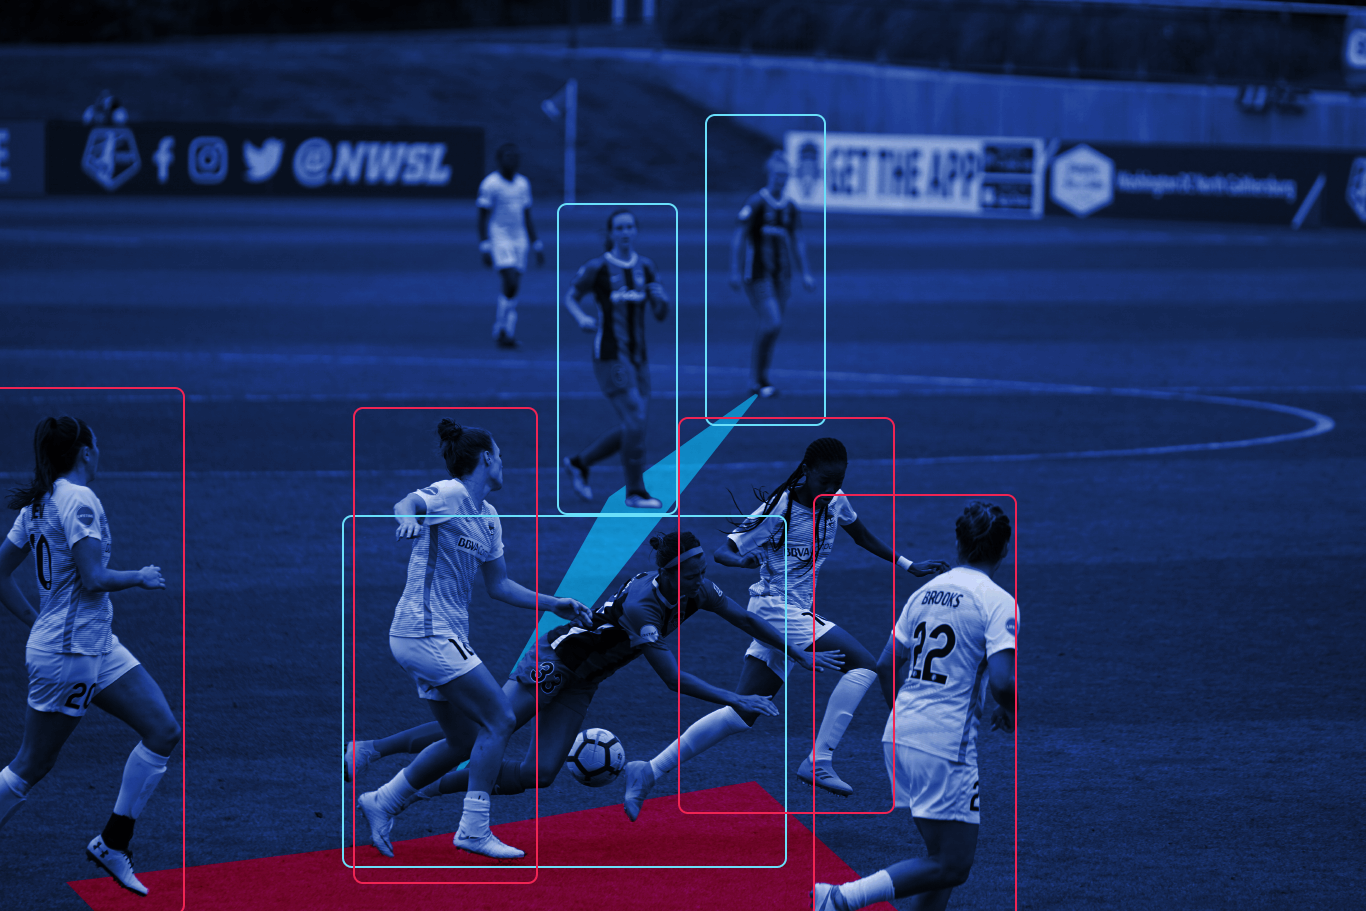
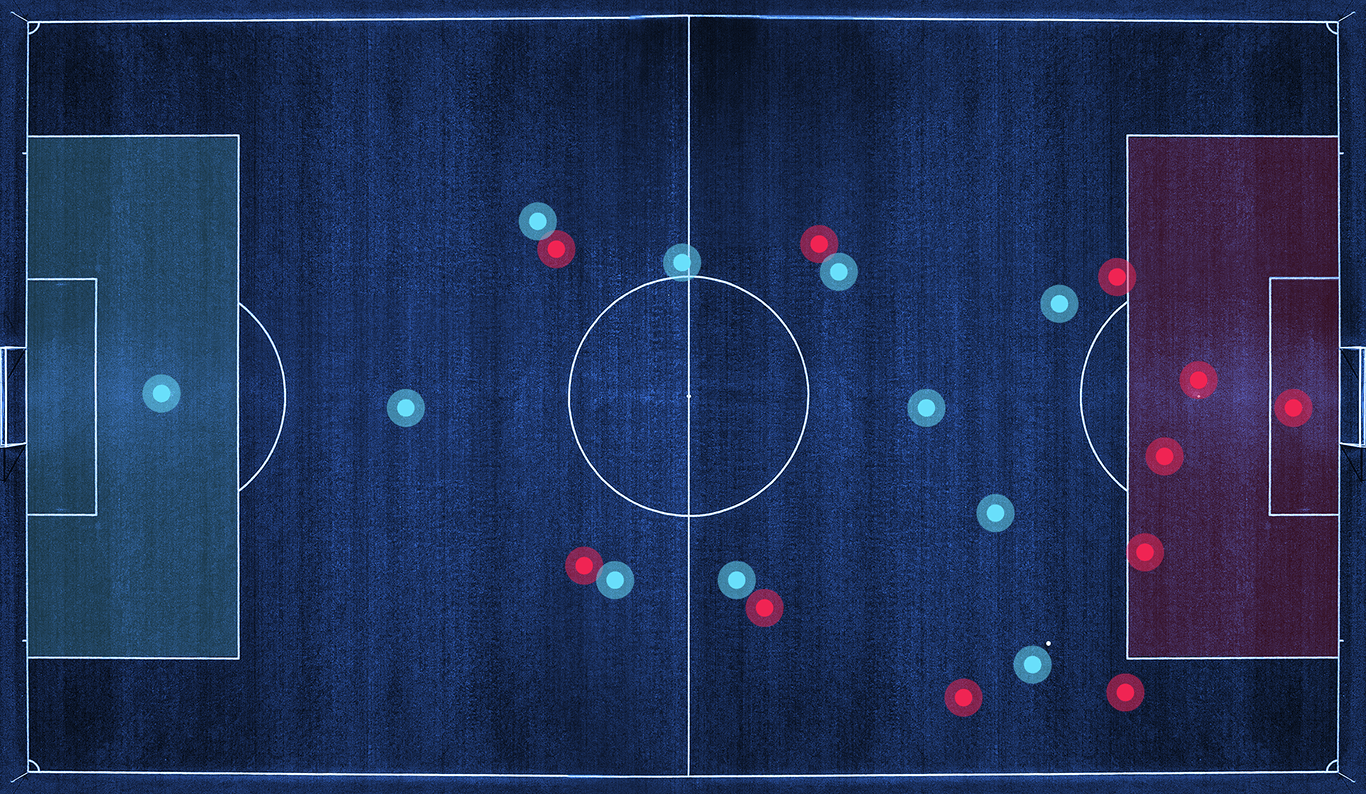
They can be measured using sensor technologies such as global positioning systems (GPS) and accelerometers, but the Computer Vision system is a far more effective way to measure these metrics.
Internal training load is a physiological and psychological response to external loads. The internal load is assessed via metrics of heart rate, blood lactate and athlete ratings of perceived exertion (RPE). This included age (yr), stature (cm), mass (kg), etc.
Also, combined metrics are considered: The Monotony Session Load — the ratio between the mean and the standard deviation of the session load and the Acute Chronic Workload Ratio (ACWR) — the ratio between a player’s acute workload and his chronic workload.
Age is included in Machine Learning model input as a proxy for playing experience, as well as a binary indicator variable for the weather — good or bad, and primary playing position — forward, back, midfield.
Absolute and relative training load metrics are calculated every day for each player.
Medical records about injuries are categorized as contact or non-contact to form the model’s outputs. Injury severity is classified as either transient – not causing unavailability for training or matches, or time-loss – a player’s unavailability for regular training or match activities.
Data preparation gives us a time series table in which each row is a vector of the most important signs as input, as well as the probability and type of Injury as output.
Neural networks and LSTM models are the best options for this task. Using the grid search, we determine the most accurate model and its parameters on a previously formed dataset.
The prediction scenario consists of the following steps. Data is recorded from the beginning of a season and a prediction model trains as time goes by. Proceeding from the first training week w1 to the most recent one wi-1. During week wi the classifiers are trained on data from weeks w1. . . wi and injuries are predicted on week wi+1.
Сoaches can use this method to decide whether or not to stop a player in the next official match or not, in the order to prevent his injury, improve team performance and reducing the sports club’s expenses.
Outcome prediction
At the Business and Data understanding stage, the input and two distinct prediction tasks are highlighted for the analysis. One task predicts the number of goals scored by each team and another — forecast into the categories win/draw/lose.
All sports generate serial measurements collected “within-game” (goals, tackles, runs, wickets and lap times which arise during play) and “between-game” (aggregate totals observed at the end of a match or competition).
- The following features can be considered as input data:
- Previous performance in the current season (won/lost/draw matches, goals scored and conceded);
- Performance in earlier encounters and Expert predictions;
- Streaks and Home advantage;
- Matches with special importance and Higher League Promotion;
- Football skills (teams’ level of offense, defense, possession, and fatigue);
- Travel Distance (geographical);
- Strategy (attacking style, defending style, etc.);
- Betting odds and Club budgets;
- Key players availability and Managerial changes.
After data preparation and feature extraction, a data table is formed, where each row is a vector of the most important signs of input, and the result of the match — is output.
RandomForest, Gradient Boosted Decision Trees and LSTM are the best pick for this task. The most accurate model and its parameters in a previously formed dataset are determined via a grid search. Such model is applied to the current match characteristics and the outcome is predicted from them.
Matches results estimate is automatically recalculated due changes in input data like a starting lineup, a physical condition of players, game conditions, etc. Thanks to this, coaches can make decisions dynamically, increasing the success chance of their team.
Coaches: an AI or a real human?
As Jim Rushton once said, that nowadays it’s only possible to compute historical data and then make recommendations. But you can’t do that fast enough to make game-time decisions. Only yet. A tremendous amount of data and a tremendous amount of money might help sports develop that sort of computational ability. With a large set of data, a clever computer can develop from past actions and outcomes. If everyone always goes for inside touch or scissor, the computer will predict it.
The power of this approach lies in the size of the data set — the more information available, the smarter the computer. For coaches, big data-driven analytics has just raised the stakes. Ignoring data is risky. In other words, coaches and strategists are better to use ‘‘cognitive skill-enhancement’’ tools in the future, driven by data. A major differentiator of players is their decision-making ability under pressure. Some players may have a tendency to pass too early or hold on to the ball for too long, given their size and speed. And data gaps can be a problem.
Teams keep secrets from one another. Most practices and training camps are off-limits to the media for fear of giving away crucial information to competitors. Sometimes unexpectedly playing the weaker of the two options is better. And only human can really understand another one. An AI can too, but only physical performance, not mental. And again — only yet.

So, Machine Learning might fine-tune scouting reports, and game theory might offer situational options, but for now — both are just ultimately tools for a coach to apply. By 2069 coaches would still be humans. Probably.
Our vision
This case is just one of the many, so don’t hesitate to learn more about our experience. Also, stay tuned to be aware of all upcoming articles! We are always eager to share our best practices and wide open to learn something new, so if you have any questions or ideas – fill free to write to us. Let’s develop the world together!